Report 2018–19
The Queensland Government reports its research and development (R&D) expenditure annually. Publishing this information is important because it:
- provides Queensland with a longitudinal study showing research-related expenditure trends over time
- identifies the fields in which the highest expenditure is made as well as the socio-economic outcomes of the research
- ensures this expenditure reflects the government’s research priorities to improve the lives of Queenslanders
- shows the valuable collaborations between government and partner organisations
- shows how Queenslanders are benefitting from the R&D activities.
Queensland Government R&D spend has been publicly reported since 2004.
View the previous reports and the detailed data from all the reports is published on the Queensland Government open data portal.
1. Defining research and development
The internationally recognised Organisation for Economic Cooperation and Development (OECD) definition of R&D is used for the purposes of this report:
"…creative work undertaken on a systematic basis in order to increase the stock of knowledge, including knowledge of man, culture and society, and the use of this stock of knowledge to devise new applications" (Frascati Manual, 2015).
The above definition aligns with the US National Science Foundation guidelines which defines R&D as creative and systematic work undertaken in order to increase the stock of knowledge and to devise new applications of available knowledge. This includes:
- activities aimed at acquiring new knowledge or understanding without specific immediate applications or uses (basic research)
- activities aimed at solving a specific problem or meeting a specific objective (applied research)
- systematic work, drawing on research and practical experience and resulting in additional knowledge, which is directed to producing new products or processes or to improving existing products or processes (development).
Some examples of R&D activities include (and are not limited to):
- laboratory research aimed at discovery of new knowledge
- searching for applications of new research findings or other knowledge
- conceptual formulation and design of possible product or process alternatives
- testing in search for or evaluation of product or process alternatives
- modification of the formulation or design of a product or process
- design, construction, and testing of preproduction prototypes and models
- design and development of tools used to facilitate R&D or components of a product or process undergoing R&D activities.
R&D excludes: market surveys; extension or commercialisation of R&D; routine computer programming and maintenance; general purpose data collection using standard techniques; policy-related studies using existing methodologies; or any other activities that do not consist of elements of novelty or understanding of causal relationships.
R&D is a major driving force behind long-term productivity and economic growth as there is a high correlation between GDP per capita and R&D intensity. R&D directly influences the strength and competitiveness of industry by providing a basis for technological change and thereby encouraging economic development.
Investment in R&D not only monetises benefits to the economy, but addresses various societal challenges faced in today’s world, such as climate change, waste minimisation, food security, etc., resulting in improvements in the quality of our lives. A CSIRO report stated that the return on investment for publicly funded scientific R&D is approximately 2:1 which emphasises the impact of R&D on the overall innovation system and economy.
“Cutting investments in R&D will undermine our future economic competitiveness and growth, as well as the quality of our lives and those of our children and grandchildren." Professor Paul Bertsch
2. Key findings
![]() $356m was spent on R&D in 2018–19, consistent with $353m in 2017–18
$356m was spent on R&D in 2018–19, consistent with $353m in 2017–18
![]() 51% of the R&D expenditure was leveraged at a rate of 1:1.13
51% of the R&D expenditure was leveraged at a rate of 1:1.13
![]() 93% of the total expenditure in 2018-19 related to current operational costs
93% of the total expenditure in 2018-19 related to current operational costs
![]() $113.4m was the highest expenditure by Queensland Health followed by Department of Agriculture and Fisheries at $92.6m.
$113.4m was the highest expenditure by Queensland Health followed by Department of Agriculture and Fisheries at $92.6m.
3.Queensland Government investment in R&D
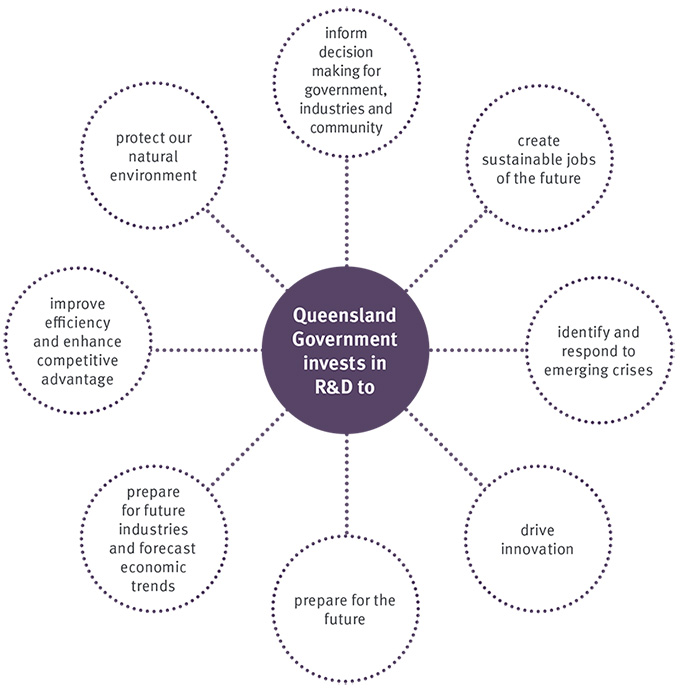
Queensland Government invests in research and development to:
- inform decision making for the government, industries and community
- create sustainable jobs of the future
- identify and respond to emerging crises
- drive innovation
- prepare for the future
- prepare for future industries and forecast economic trends
- improve efficiency and enhance competitive advantage
- protect our natural environment.
The research conducted by the Queensland Government on the Great Barrier Reef exemplifies the objectives illustrated in the diagram. Not only does the research provide information on the risks faced by the reef, and the factors needed to maintain a healthy ecosystem, but also insights into agricultural practices, waste water management, marine resource management, sustainable tourism, and marine transport practices.
4. Queensland Government priorities
Examining the R&D annual expenditure can provide insights into funding and collaboration trends, and shows how the Queensland Government’s expenditure meets its policy priorities.
The nature of R&D, as defined earlier, is an investigative and exploratory process with unknown outcomes. As such R&D is not confined to the state’s policy priorities, but rather can exceed and overflow into areas of potential innovation.
Reporting R&D expenditure also provides insights into the health of Queensland’s science, technology, and innovation sectors. While R&D investment is just one metric of innovation, tracking R&D can provide insights into the status of collaborations between industry, government, and researchers, as well as R&D trends.
5. Expenditure over time
Queensland’s annual R&D expenditure was stable from 2004-05 to 2007-08. It doubled in 2008-09 and continued to increase until peaking at 2010-11. The increase in annual expenditure (with the highest spend of $701 million in 2010–11) was due to significant investment on research infrastructure, including establishing the Translational Research Institute at Woolloongabba, the QIMR Berghofer Medical Research Institute at Herston, the Health and Food Sciences Precinct at Coopers Plains, and the Ecosciences Precinct at Boggo Road, Dutton Park. Following completion of the infrastructure works, around 2013-14, annual expenditure stabilised to around $350 million over the next five years to 2018–19.
The figure below summarises expenditure over the last 15 years.
| Year | Total R&D expenditure ($m) |
|---|---|
| 2018-19 | 356.0 |
| 2017-18 | 352.8 |
| 2016-17 | 351.5 |
| 2015-16 | 313.6 |
| 2014-15 | 353.3 |
| 2013-14 | 362.0 |
| 2012-13 | 523.0 |
| 2011-12 | 634.0 |
| 2010-11 | 701.0 |
| 2009-10 | 566.0 |
| 2008-09 | 533.0 |
| 2007-08 | 265.0 |
| 2006-07 | 228.0 |
| 2005-06 | 231.0 |
| 2004-05 | 229.0 |
6. Capital vs current expenditure
Capital expenditure is major infrastructure spending that may include land and buildings, instrument and equipment, and computer software.
Current expenditure is operational spending, for example, spending on items such as employee expenses, salaries, supplies and services, grants, and other R&D project-related expenses.
Capital and current expenditures were reported separately for the first time for the 2009–10 period. Prior to this, both types of expenditure were combined and reported as a total amount.
In 2018–19, 93% ($331 million) of R&D expenditure across all agencies related to current expenditure, and 4% ($12.9 million) was expended on capital, with the remainder reported as ‘various’. The highest capital spend was during 2008 to 2013 when four major research precincts were constructed.
| Year | Capital expenditure ($m) | Current expenditure ($m) |
|---|---|---|
| 2018-19 | 12.9 | 331.1 |
| 2017-18 | 9.7 | 343.1 |
| 2016-17 | 21.1 | 330.4 |
| 2015-16 | 22.3 | 291.3 |
| 2014-15 | 11.0 | 342.3 |
| 2013-14 | 9.8 | 352.2 |
| 2012-13 | 117.3 | 405.7 |
| 2011-12 | 213.2 | 420.8 |
| 2010-11 | 288.0 | 413.0 |
| 2009-10 | 222.9 | 343.1 |
7. Expenditure by agency
The total Queensland Government R&D spend for the 2018–19 financial year was more than $356 million across 18 agencies (this includes both Queensland Government and leveraged funds). The distribution ranges from $44,000 spent by the Inspector-General Emergency Management to $113 million spent by Queensland Health.
Similar to previous years, R&D expenditure of four agencies accounts for 80% of the total expenditure, including:
- Department of Health (including 14 Hospital and Health Services)*
- Department of Agriculture and Fisheries (including Biosecurity Queensland)
- QIMR Berghofer Medical Research Institute
- Department of Innovation, Tourism Industry Development and the Commonwealth Games.
*Please note that data from Cairns and Hinterland and Townsville Hospital and Health Services were not available for analysis when data was collected for this report.
Traditionally, Queensland Health and the Department of Agriculture and Fisheries are the highest spenders on R&D. Queensland Health accounted for 32% of the overall expenditure, and the Department of Agriculture and Fisheries represented 26%.
| Government Agencies | Total R&D Expenditure ($m) |
|---|---|
| Queensland Health | 113.4 |
| Department of Agriculture and Fisheries | 92.6 |
| QIMR Berghofer Medical Research Institute | 51.1 |
| Department of Innovation, Tourism Industry Development and the Commonwealth Games | 27.9 |
| Motor Accident Insurance Commission | 15.1 |
| Department of Natural Resources, Mines and Energy | 14.3 |
| Department of Transport and Main Roads | 13.4 |
| Department of Environment and Science | 11.3 |
| Department of Education | 10.9 |
| Department of Housing and Public Works | 1.3 |
| Queensland Museum | 1.3 |
| Queensland Police Service | 1.2 |
| Queensland Corrective Services | 1.0 |
| Department of Child Safety, Youth and Women | 0.6 |
| Queensland Fire and Emergency Services | 0.3 |
| Department of Justice and Attorney General | 0.2 |
| Department of Communities, Disability Services and Seniors | 0.1 |
| Inspector-General Emergency Management | 0.04 |
8. Queensland Government vs leveraged funds by year
Queensland Government funds are those spent directly from the state budget allocation. Leveraged funds refer to cash contributions from external organisations towards R&D projects funded or performed by the Queensland Government. This only includes direct contributions, that is, the expenditure forming part of an R&D contract or agreement. This does not include in-kind support, for example, the use of internal databases or staff time not directly attributed to the project.
Since reporting commenced in 2004–05, leveraged funds have been overall slightly lower than Queensland Government investment. Exceptions to this occurred in 2010–13 due to infrastructure investment through leveraged funds; in 2017–18 when leveraged funds were $8 million more than government funds; and in 2018-19 when leveraged funds exceeded government funds by more than $20 million.
For every dollar invested by the Queensland Government an additional $1.13 was secured from other sources, including the Australian Government, universities and businesses. If indirect contributions were to be included this would be even greater.
| Year | Queensland Government funds ($m) | Leveraged funds ($ m) |
|---|---|---|
| 2018-19 | 161.7 | 182.4 |
| 2017-18 | 172.3 | 180.4 |
| 2016-17 | 175.9 | 175.6 |
| 2015-16 | 163.8 | 149.8 |
| 2014-15 | 180.0 | 173.3 |
| 2013-14 | 185.0 | 177.0 |
| 2012-13 | 203.0 | 320.0 |
| 2011-12 | 231.0 | 403.0 |
| 2010-11 | 295.0 | 406.0 |
| 2009-10 | 365.0 | 201.0 |
| 2008-09 | 385.0 | 148.0 |
| 2007-08 | 196.0 | 70.0 |
| 2006-07 | 174.0 | 54.0 |
| 2005-06 | 176.0 | 55.0 |
| 2004-05 | 168.0 | 61.0 |
9. Queensland Government vs leveraged funds by agency
Leveraged funds for the 2018–19 financial year are highly concentrated with just four of the 18 entities representing 89% of the total. The Department of Agriculture and Fisheries was the highest spender of Queensland Government funds ($56 million) and was third highest to attract leveraged funds ($36 million). Queensland Health spent $39 million on R&D and leveraged almost double its expenditure at $62.3 million.
| Government Agencies | Queensland Government Funds ($m) | Leveraged Funds ($m) | Various ($m) |
|---|---|---|---|
| Queensland Health | 39.09 | 62.28 | 12.00 |
| Department of Agriculture and Fisheries | 56.30 | 36.34 | - |
| QIMR Berghofer Medical Research Institute | 0.00 | 51.09 | - |
| Department of Innovation, Tourism Industry Development and the Commonwealth Games | 15.90 | 11.98 | - |
| Motor Accident Insurance Commission | 12.56 | 2.49 | - |
| Department of Natural Resources, Mines and Energy | 11.37 | 2.98 | - |
| Department of Transport and Main Roads | 7.48 | 5.94 | - |
| Department of Environment and Science | 10.20 | 1.13 | - |
| Department of Education | 4.18 | 6.67 | - |
| Department of Housing and Public Works | 1.34 | 0.00 | - |
| Queensland Museum | 0.92 | 0.33 | - |
| Queensland Police Service | 0.15 | 1.00 | - |
| Queensland Corrective Services | 0.99 | 0.00 | - |
| Department of Child Safety, Youth and Women | 0.57 | 0.07 | - |
| Queensland Fire and Emergency Services | 0.34 | 0.00 | - |
| Department of Justice and Attorney General | 0.13 | 0.05 | - |
| Department of Communities, Disability Services and Seniors | 0.11 | 0.00 | - |
| Inspector-General Emergency Management | 0.04 | 0.00 | - |
10. Research location by year
This section categorises the location of where the funding was spent as either ‘in-house’ or ‘external’. In-house refers to R&D being conducted at Queensland Government sites, for example the Ecosciences Precinct. R&D activity occurring at non-Queensland government sites such as universities, businesses, international locations etc., have been categorised as external.
The figure provides a historic representation of the high level of R&D activities undertaken at government locations from 2004 to 2010. The trend reverses to higher R&D activity related expenditure in external locations for projects undertaken between 2010 and 2014. The ratio reverts to a higher expenditure of in-house R&D activities between 2014 and 2019, upon completion of proposed research facilities referred to above.
| Year | In-house ($m) | External ($m) |
|---|---|---|
| 2018-19 | 222.4 | 121.6 |
| 2017-18 | 206.0 | 146.8 |
| 2016-17 | 188.2 | 163.3 |
| 2015-16 | 184.0 | 129.6 |
| 2014-15 | 201.0 | 152.3 |
| 2013-14 | 73.0 | 289.0 |
| 2012-13 | 224.0 | 299.0 |
| 2011-12 | 238.0 | 396.0 |
| 2010-11 | 286.0 | 415.0 |
| 2009-10 | 312.0 | 254.0 |
| 2008-09 | 286.0 | 247.0 |
| 2007-08 | 176.0 | 89.0 |
| 2006-07 | 176.0 | 52.0 |
| 2005-06 | 166.0 | 65.0 |
| 2004-05 | 167.0 | 62.0 |
11. Locations of research conducted
This chart illustrates how this year’s total R&D expenditure was allocated between in-house and external locations. Similar to the previous year, nearly 62% of funding ($222 million) was spent on R&D at in-house Queensland Government locations. The remainder occurred in a variety of external locations including:
- universities (18%)
- other government bodies and statutory authorities (6.8%)
- joint business/government organisations (4.3%)
- business sector (3.7%).
Minor work was carried out at private non-profit organisations and in other state or local government entities.
| R&D Location | Total Expenditure ($m) |
|---|---|
| In-house | 218.5 |
| Universities | 63.3 |
| Government bodies and statutory authorities | 24.2 |
| Joint business/government organisations | 15.3 |
| Business sector | 13.2 |
| Various | 12.0 |
| Other Queensland Government departments | 3.8 |
| Private/non-profit organisation | 1.6 |
| Other Australian locations | 1.5 |
| Australian Government | 1.2 |
| Overseas locations | 1.1 |
| Other state/local government | 0.2 |
12. Spending in relation to socio-economic objectives
Agencies classify R&D investment according to the Australian Bureau of Statistics’ socio-economic objectives. The objectives relate to the impact of the research and are standardised fields. Not surprisingly, the distribution of the expenditure by socio-economic objective matches the socio-economic focus of Queensland’s largest R&D agencies, in that 85% of the total distribution across the 16 objectives is represented by four objectives:
- health
- plant production and plant primary products
- environment
- animal production and animal primary products.
This is reflected in the investment in portfolios such as Queensland Health, Department of Agriculture and Fisheries, QIMR Berghofer Medical Research Institute, and the Department of Innovation, Tourism Industry Development and the Commonwealth Games. This is in line with overall expenditure distribution that showed 80% of spending was executed by four of the 18 agencies
| Socio-economic Objective | Total Expenditure ($m) |
|---|---|
| Health | 188.6 |
| Plant Production and Plant Primary Products | 73.7 |
| Environment | 20.6 |
| Animal Production and Animal Primary Products | 19.5 |
| Transport | 19.3 |
| Mineral Resources (excl. Energy Resources) | 10.1 |
| Education and Training | 6.2 |
| Manufacturing | 5.8 |
| Expanding Knowledge | 3.3 |
| Law, Politics and Community Services | 3.0 |
| Energy | 2.6 |
| Defence | 1.8 |
| Information and Communication Services | 0.6 |
| Construction | 0.4 |
| Commercial Services and Tourism | 0.4 |
| Cultural Understanding | 0.2 |
13. Spending based on field of research
Fields of research are defined by the Australian Bureau of Statistics and enable R&D activities to be categorised according to the methodology used (not the activity, nor the purpose).
The analysis of R&D expenditure by field of research attributes:
- $185.7 million to medical and health sciences
- $91.8 million to agricultural and veterinary sciences.
This mirrors the two highest spending agencies in R&D, namely Queensland Health, and the Department of Agriculture and Fisheries. The medical and health sciences sector represents over half (52%) of the expenditure by field of research, and is ten times larger than the average across the 21 fields. Eighty-three per cent of the total expenditure is highly concentrated into just three of the 21 fields of research: medical and health sciences; agricultural and veterinary sciences; and environmental sciences.
| Field of Research | Total Expenditure ($m) |
|---|---|
| Medical and Health Sciences | 185.75 |
| Agricultural and Veterinary Sciences | 91.77 |
| Environmental Sciences | 17.10 |
| Engineering | 15.29 |
| Technology | 12.38 |
| Earth Sciences | 10.86 |
| Education | 5.57 |
| Psychology and Cognitive Sciences | 5.47 |
| Information and Computing Sciences | 2.75 |
| Studies in Human Society | 2.45 |
| Biological Sciences | 2.29 |
| Law and Legal Studies | 1.15 |
| Chemical Sciences | 1.06 |
| Built Environment and Design | 0.78 |
| Commerce, Management, Tourism and Services | 0.69 |
| Economics | 0.23 |
| Mathematical Sciences | 0.15 |
| Physical Sciences | 0.13 |
| History and Archaeology | 0.07 |
| Language, Communication and Culture | 0.07 |
| Studies in Creative Arts and Writing | 0.04 |
14. Highlights of R&D delivering for Queenslanders
Importance of coral reefs
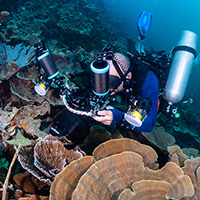 (Queensland Museum)
The Queensland Museum is using new techniques to explore why some coral can grow in marginal habitats while others cannot. This will help researchers understand why reef ecosystems around the world occur across a wide range of environments, including areas that would normally be considered marginal for coral growth. This project will improve our understanding of how corals adapt to environmental change, and these insights will help inform their future management.
Safer bone marrow transplants
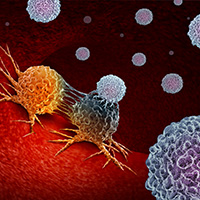 (QIMR Berghofer Medical Research Institute)
QIMR Berghofer Medical Research Institute led Australia’s first clinical trial using genetically engineered immune cells to make bone marrow transplants safer for blood cancer patients. The team took immune cells from partially matched bone marrow donors and inserted a gene into the cells that allowed them to be killed off if they caused complications. The patients received the immune cells after their bone marrow transplant at the Royal Brisbane and Women’s Hospital, with one patient now in remission for four years. This amazing work was funded by the National Health and Medical Research Council of Australia and supported by the Queensland Government.
Disaster preparedness
 (Inspector-General Emergency Management)
Inspector-General Emergency Management (IGEM), in partnership with the Bushfire and Natural Hazards Centre for Cooperative Research, has contributed to a Community Engagement Techniques Toolkit, and a Measurement and Evaluation Toolkit to further assess and improve community disaster preparedness. IGEM contributed $10,000 towards the project with partners including Queensland Fire and Emergency Services, Ipswich City Council, Tablelands Regional Council, Cairns Regional Council, NSW State Emergency Service, and the Department of Fire and Emergency Services in Western Australia. The project was run by Dr Barbara Ryan (University of Southern Queensland) and Dr Kim Johnson (Queensland University of Technology) and Prof Maureen Taylor (University of Technology Sydney).
Humanoid robotics
 (Department of Innovation, Tourism Industry Development and the Commonwealth Games)
The Humanoid Robotics Research and Development Partnership Program is bringing together world-class researchers from Queensland University of Technology’s Australian Centre for Robotic Vision and robotics manufacturing expertise from the Japanese technology giant, SoftBank Corp. funded up to $1.5 million over three years, the project will establish Queensland as a leader in the field of robotics and human interaction. The project promotes collaboration between robotics researchers and experts in technology uptake to jointly explore and develop new and innovative technologies and solutions in humanoid robotics.
Naturally Nutritious
 (Department of Agriculture and Fisheries)
The Department of Agriculture and Fisheries is collaborating with Horticulture Innovation Australia, to jointly fund and investigate the potential to increase the nutrient density of a range of foods to deliver greater nutritional benefits per serve. Naturally Nutritious will also identify the nutritional impacts of the supply chain process and what measures can be undertaken to maintain food quality.
Jamieson Trauma Institute
 (Motor Accident Insurance Commission)
Jamieson Trauma Institute brings together clinical services, disaster management, military training, trauma epidemiology, as well as science and research institutions to deliver the best possible care to people who suffer a traumatic injury. It was established in July 2018 through a partnership between the Motor Accident Insurance Commission and the Metro North Hospital and Health Service at the Royal Brisbane and Women's Hospital. It operates in partnerships with government agencies, hospitals and health services, colleges, academic, research and industry partners with over $2 million invested in 2018-19.
Creating Pathways to Prevention
 (Department of Education)
Four Queensland government agencies and Griffith University are collaborating to improve community disadvantage and child welfare through the Creating Pathways to Prevention program. The program builds capacity in community based support agencies to better meet the needs of the children and families. The program had an overall expenditure of $694,000 in 2018–19.
SPIKE program
 (Department of Housing and Public Works)
The Queensland Academy of Sport’s (QAS) Sport Performance Innovation and Knowledge Excellence (SPIKE) program connects governments, universities, industry and the community to share information on improving athletic performance and sports science. SPIKE has 12 new collaborative agreements, with cash contributions from research partners of almost $850,000 and QAS committing over $450,000.
Offender Management Renewal Program
 (Queensland Corrective Services)
Queensland Corrective Service’s Specialist Operations Team undertook a time and motion study to explore offender assessments and management across custodial and community corrections locations. The research, funded through the department’s recent review into the Queensland Parole System Review, was undertaken in partnership with a private sector organisation. A total of $134,000 was dedicated to completion of this phase of work, with almost $117,000 expended in 2018–19. The QCS Annual Report 2018–19 provides more information about this program.