Report 2019–20
The Queensland Government reports its research and development (R&D) expenditure annually. Publishing this information is important because it:
- provides Queensland with a longitudinal study showing research-related expenditure trends over time
- identifies the fields in which the highest expenditure is made as well as the socio-economic outcomes of the research
- ensures this expenditure reflects the government’s research priorities to improve the lives of Queenslanders
- shows the valuable collaborations between government and partner organisations
- shows how Queenslanders are benefitting from R&D activities.
Queensland Government R&D spend has been publicly reported since 2004.
View previous reports or the detailed data on the Queensland Government open data portal.
A shorter version of the data will be published biennially, with the alternate years’ publications being a more comprehensive report with case studies and highlights.
1. Defining research and development
The internationally recognised Organisation for Economic Cooperation and Development (OECD) definition of R&D is used for the purposes of this report:
‘…creative work undertaken on a systematic basis in order to increase the stock of knowledge, including knowledge of man, culture and society, and the use of this stock of knowledge to devise new applications’ (Frascati Manual, 2015).
To be R&D, the work needs to:
- produce new knowledge
- create new knowledge
- have a a systematic methodology and progression (happens in stages)
- deliver an uncertain outcome
- be transferable or reproducible.
R&D excludes:
- market surveys
- extension or commercialisation of R&D
- routine computer programming and maintenance
- general purpose data collection using standard techniques
- policy-related studies using existing methodologies
- other activities that do not consist of elements of novelty or understanding of causal relationships.
2. Key findings
![]() Approximately $380m was reported as spent on R&D in 2019–20, around $30m more than the $356m reported in 2018–19
Approximately $380m was reported as spent on R&D in 2019–20, around $30m more than the $356m reported in 2018–19
![]() Leveraged funds from external sources accounted for approximately 41% of reported expenditure, 10% lower than the 51% reported in 2018-19
Leveraged funds from external sources accounted for approximately 41% of reported expenditure, 10% lower than the 51% reported in 2018-19
![]() 96% of the total reported expenditure in 2019-20 related to current operational costs
96% of the total reported expenditure in 2019-20 related to current operational costs
![]() Queensland Health reported the highest expenditure at $125.5m significantly higher than the second highest reported expenditure by the Department of Agriculture and Fisheries at $95.6m.
Queensland Health reported the highest expenditure at $125.5m significantly higher than the second highest reported expenditure by the Department of Agriculture and Fisheries at $95.6m.
3. Queensland Government investment in R&D
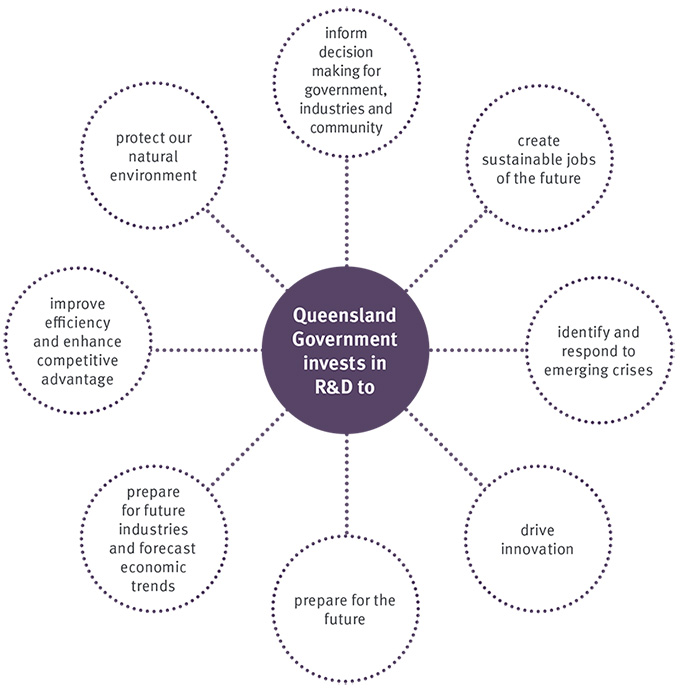
Queensland Government invests in research and development to:
- inform decision making for the government, industries and community
- create sustainable jobs for the future and drive innovation
- prepare for the future by identifying and responding to emerging crises
- prepare for future industries and forecast economic trends
- improve efficiency and enhance competitive advantage
- protect our natural environment.
4. Expenditure over time
Queensland’s annual R&D expenditure was stable until 2007–08, and then doubled in 2008–09 and continued to increase before levelling out in 2012–13. In 2013–14, the R&D expenditure reduced slightly then remained consistent for the next five years. The higher expenditure between 2008 and 2013 was due to expenditure on research infrastructure, including the Translational Research Institute, the 13-storey third building of the QIMR Berghofer Medical Research Institute, the Ecosciences Precinct, and the Health and Food Sciences Precinct. After completion of those works, expenditure returned to around $350 million in 2018–19.
The figure below summarises expenditure over the last 15 years.
| Year | Total R&D expenditure ($m) |
|---|---|
| 2019–20 | 380.5 |
| 2018–19 | 356.0 |
| 2017–18 | 352.8 |
| 2016–17 | 351.5 |
| 2015–16 | 313.6 |
| 2014–15 | 353.3 |
| 2013–14 | 362.0 |
| 2012–13 | 523.0 |
| 2011–12 | 634.0 |
| 2010–11 | 701.0 |
| 2009–10 | 566.0 |
| 2008–09 | 533.0 |
| 2007–08 | 265.0 |
| 2006–07 | 228.0 |
| 2005–06 | 231.0 |
| 2004–05 | 229.0 |
5. Capital vs current expenditure
Capital expenditure is major infrastructure spending including land, buildings, instruments, equipment, and computer software.
Current expenditure is operational spending, such as employee expenses, salaries, supplies and services, grants, and other R&D project-related expenses.
In 2019–20, 96% ($365 million) of R&D expenditure across all agencies was current expenditure, and 4% ($15 million) was expended on capital.
| Year | Capital expenditure ($m) | Current expenditure ($m) |
|---|---|---|
| 2019–20 | 13.8 | 366.6 |
| 2018–19 | 12.9 | 331.1 |
| 2017–18 | 9.7 | 343.1 |
| 2016-17 | 21.1 | 330.4 |
| 2015–16 | 22.3 | 291.3 |
| 2014–15 | 11.0 | 342.3 |
| 2013–14 | 9.8 | 352.2 |
| 2012–13 | 117.3 | 405.7 |
| 2011–12 | 213.2 | 420.8 |
| 2010–11 | 288.0 | 413.0 |
| 2009–10 | 222.9 | 343.1 |
6. Expenditure by agency
The total Queensland Government R&D spend for the 2019–20 financial year was more than $380 million across 21 agencies (this includes both Queensland Government and leveraged funds). The distribution ranges from $27,000 spent by Justice and Attorney-General to $125 million spent by Queensland Health.
Of the total Queensland Government expenditure, 71% was attributed to 4 of the 21 agencies including:
- Department of Health
- Department of Agriculture and Fisheries (including Biosecurity Queensland)
- QIMR Berghofer Medical Research Institute
- Department of Innovation, Tourism and Industry Development.
Traditionally, Queensland Health and the Department of Agriculture and Fisheries are the highest spenders on R&D. Queensland Health accounted for 33% of the overall expenditure, and the Department of Agriculture and Fisheries represented 25%.
| Government agency | Total R&D expenditure ($m) |
|---|---|
| Queensland Health | 125.5 |
| Department of Agriculture and Fisheries | 95.5 |
| QIMR Berghofer Medical Research Institute | 50.4 |
| Department of Innovation, Tourism and Industry Development | 34.2 |
| Motor Accident Insurance Commission | 17.7 |
| Department of Natural Resources, Mines and Energy | 15.9 |
| Department of Environment and Science | 11.8 |
| Department of Transport and Main Roads | 10.2 |
| Department of Education | 9.2 |
| Queensland Museum | 4.8 |
| Department of Housing and Public Works | 1.4 |
| Department of Youth Justice | 0.9 |
| Department of Child Safety, Youth and Women | 0.5 |
| Queensland Fire and Emergency Services | 0.4 |
| Department of the Premier and Cabinet | 0.4 |
| Queensland Corrective Services | 0.3 |
| Queensland Police Service | 0.2 |
| Department of Communities, Disability Services and Seniors | 0.1 |
| Competition Authority | 0.1 |
| Inspector-General Emergency Management | 0.05 |
| Department of Justice and Attorney General | 0.02 |
7. Queensland Government vs leveraged funds by year
Queensland Government funds are those spent directly from the state budget allocation. Leveraged refers to cash contributions from external organisations towards R&D projects funded or performed by the Queensland Government. This only includes direct contributions (the expenditure forming part of an R&D contract or agreement) and does not include in-kind support (for example, use of internal databases or staff time not directly attributed to the project).
For every dollar invested by the Queensland Government, $0.68 was secured from other sources, including the Australian Government, Local Governments, universities, and businesses.
| Year | Queensland Government funds ($m) | Leveraged funds ($m) |
|---|---|---|
| 2019–20 | 226.3 | 154.1 |
| 2018–19 | 161.7 | 182.4 |
| 2017–18 | 172.3 | 180.4 |
| 2016–17 | 175.9 | 175.6 |
| 2015–16 | 163.8 | 149.8 |
| 2014–15 | 180.0 | 173.3 |
| 2013–14 | 185.0 | 177.0 |
| 2012–13 | 203.0 | 320.0 |
| 2011–12 | 231.0 | 403.0 |
| 2010–11 | 295.0 | 406.0 |
| 2009–10 | 365.0 | 201.0 |
| 2008–09 | 385.0 | 148.0 |
| 2007–08 | 196.0 | 70.0 |
| 2006–07 | 174.0 | 54.0 |
| 2005–06 | 176.0 | 55.0 |
| 2004–05 | 168.0 | 61.0 |
8. Spending in relation to socio-economic objectives
Agencies classify R&D investment according to the Australian Bureau of Statistics’ socio-economic objectives; these are standardised fields. The distribution of the expenditure by socio-economic objective matches the socio-economic focus of Queensland’s largest R&D agencies. Across the 16 objectives, 84% of the total distribution is represented by 4 objectives:
- health
- plant production and plant primary products
- environment
- animal production and animal primary products.
| Socio-economic objective | Total expenditure ($m) |
|---|---|
| Health | 203.3 |
| Plant Production and Plant Primary Products | 71.7 |
| Environment | 25.2 |
| Animal Production and Animal Primary Products | 20.6 |
| Transport | 15.6 |
| Mineral Resources (excl. Energy Resources) | 14.1 |
| Energy | 5.7 |
| Manufacturing | 5.4 |
| Expanding Knowledge | 4.9 |
| Education and Training | 3.9 |
| Cultural Understanding | 1.7 |
| Law, Politics and Community Services | 1.6 |
| Other | 1.3 |
| Construction | 0.7 |
| Information and Communication Services | 0.5 |
| Economic Framework | 0.4 |
| Commercial Services and Tourism | 0.3 |
9. Spending based on field of research
Fields of research are defined by the Australian Bureau of Statistics and enable R&D activities to be categorised according to the methodology used (not the activity, nor the purpose).
The analysis of R&D expenditure by field of research attributes:
- $200.7 million to medical and health sciences
- $83.27 million to agricultural and veterinary sciences.
The same as the two highest spending agencies—Queensland Health, and the Department of Agriculture and Fisheries.
| Field of research | Total expenditure ($m) |
|---|---|
| Medical and Health Sciences | 200.7 |
| Agricultural and Veterinary Sciences | 83.3 |
| Engineering | 17.7 |
| Earth Sciences | 15.1 |
| Environmental Sciences | 14.3 |
| Mathematical Sciences | 13.3 |
| Technology | 6.8 |
| Psychology and Cognitive Sciences | 5.4 |
| Biological Sciences | 5.3 |
| Education | 4.3 |
| Studies in Human Society | 2.8 |
| Information and Computing Sciences | 2.7 |
| Other | 1.4 |
| Chemical Sciences | 1.3 |
| Economics | 1.2 |
| Built Environment and Design | 1.1 |
| Language, Communication and Culture | 0.8 |
| History and Archaeology | 0.8 |
| Commerce, Management, Tourism and Services | 0.7 |
| Physical Sciences | 0.5 |
| Law and Legal Studies | 0.3 |
