Report 2021–22
The Queensland Government reports its research and development (R&D) expenditure annually. Publishing this information is important because it:
- provides Queensland with a longitudinal study showing research-related expenditure trends over time
- identifies the fields in which the highest expenditure is made as well as the socio-economic outcomes of the research
- ensures this expenditure reflects the government’s research priorities to improve the lives of Queenslanders
- shows the valuable collaborations between government and partner organisations
- shows how Queenslanders are benefitting from R&D activities.
Queensland Government R&D spend has been publicly reported since 2004.
View previous reports or the detailed data on the Queensland Government open data portal.
A shorter version of the data will be published biennially, with the alternate years’ publications being a more comprehensive report with case studies and highlights.
1. Defining research and development
For the purpose of this report, and in line with the guidelines provided by the Organisation for Economic Cooperation and Development (OECD), the definition of R&D used by the government is:
‘…creative and systematic work undertaken in order to increase the stock of knowledge – including knowledge of humankind, culture and society – and to devise new applications of available knowledge’ (Frascati Manual, 2015).
To fall under this definition, and therefore being eligible as R&D, an activity must be:
- novel
- creative
- uncertain
- systematic
- transferable and/or reproducible.
Some examples of R&D activities include (and are not limited to):
- Laboratory research aimed at discovery of new knowledge.
- Searching for applications of new research findings or other knowledge.
- Conceptual formulation and design of possible product or process alternatives.
- Evaluation of product or process alternatives.
- Modification of the formulation or design of a product or process.
- Design, construction, and testing of preproduction prototypes and models.
- Design and development of tools used to facilitate R&D or components of a product or process undergoing R&D activities.
R&D excludes:
- Market surveys.
- Extension or commercialisation of R&D.
- Routine computer programming and maintenance.
- General purpose data collection using standard techniques without a research question.
- Policy-related studies using existing methodologies.
- Any other related activities that do not consist of elements of novelty or understanding causal relationship.
2. Key findings
Around $394 million was spent by the Queensland Government (the government) on research and development (R&D) in 2021–22, which represents a slight moderation of 11 per cent following a relatively strong outcome of $444 million in 2020–21. The largest dollar amount decrease was reported by Queensland Health at $25 million (50 per cent) of the yearly decrease. Queensland Health confirmed that over the last four years the R&D expenditure was on an upward trajectory. This year the expenditure fell to a similar level to the 2019-20 figure.
Around $273 million (69 per cent) of the total R&D expenditure for the year was conducted at Queensland Government sites.
R&D expenditure for 2021–22 includes capital and current expenditure:
- Capital expenditure refers to infrastructure spending such as buildings, land, and equipment
- Current expenditure refers to operational spending such as employee expenses, salaries, and other R&D related expenditure.
Approximately $369 million (93 per cent) of the total expenditure was related to current expenditure.
Out of the $394 million that was spent on R&D, leveraged funds from external sources made up approximately $177 million (45 per cent) of the reported expenditure. By comparison, in 2020–21 leveraged funds made up approximately $202 million (45 per cent) of the reported expenditure.
The department reporting the highest R&D expenditure was Queensland Health (not including QIMR) totalling $127 million equivalent (32 per cent) of the total R&D expenditure for the year followed by the Department of Agriculture and Fisheries at $107 million (27 per cent) of the reported R&D expenditure.
Queensland Heath and the Department of Agriculture and Fisheries were also the two highest spending departments in 2020–21 at $152 million (34 per cent) and 101 million (23 per cent) respectively of the total R&D expenditure for the year, and in 2019-20 at $125 million (32 per cent) and $95 million (25 per cent) respectively of the total R&D expenditure for the year.
3. Queensland Government investment in R&D
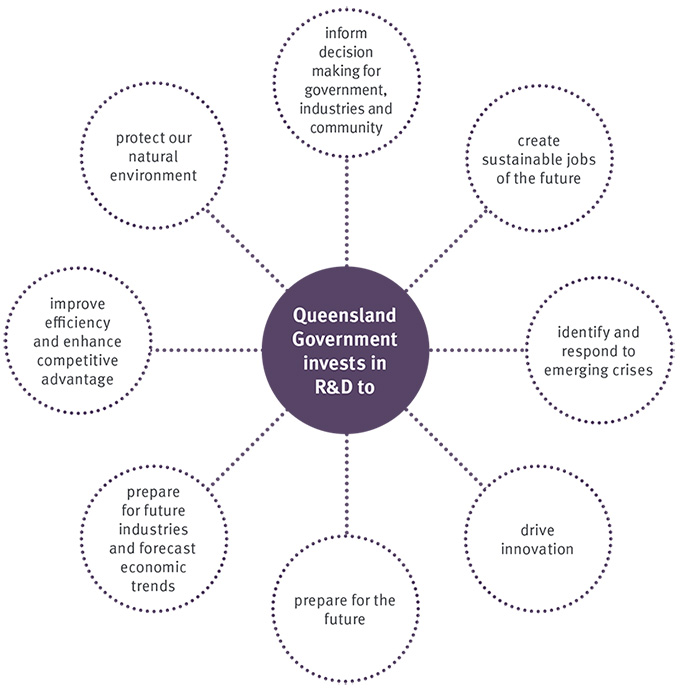
Queensland Government invests in research and development to:
- inform decision making for the government, industries and community
- create sustainable jobs for the future and drive innovation
- prepare for the future by identifying and responding to emerging crises
- prepare for future industries and forecast economic trends
- improve efficiency and enhance competitive advantage
- protect our natural environment.
4. Expenditure over time
In 2021–22, Queensland Government agencies reported spending $394 million on R&D, which represents an 11 per cent decrease from the previous year’s expenditure of $444 million. The largest dollar amount decrease was reported by Queensland Health at $25 million (50 per cent) of the yearly decrease.
The graph below shows the R&D expenditure by the government over the last 18 years. Through the Smart State strategies which ran from 1998 to 2012, there was significant R&D expenditure on major research infrastructure that peaked at $701 million in 2010–11. These projects included: the Ecosciences Precinct at Dutton Park, Health and Food Sciences Precinct at Coopers Plains, QIMR Berghofer Medical Research Institute, and the Translational Research Institute, to name a few.
The decline in R&D expenditure from 2012 to 2015 partly relates to the completion of various infrastructure projects and the cessation of the Smart State strategies. Since 2015, investment in R&D by the government has been on a consistently increasing trend. In 2021–22, the data show a slight moderation following a relatively strong outcome in 2020–21.
| Year | Total expenditure ($) |
|---|---|
| 2004–05 | $229,000,000 |
| 2005–06 | $231,000,000 |
| 2006–07 | $228,000,000 |
| 2007–08 | $265,000,000 |
| 2008–09 | $533,000,000 |
| 2009–10 | $566,000,000 |
| 2010–11 | $701,000,000 |
| 2011–12 | $634,000,000 |
| 2012–13 | $523,000,000 |
| 2013–14 | $362,000,000 |
| 2014–15 | $353,294,420 |
| 2015–16 | $313,556,211 |
| 2016–17 | $351,476,714 |
| 2017–18 | $352,777,424 |
| 2018–19 | $356,033,885 |
| 2019–20 | $380,469,811 |
| 2020–21 | $444,738,239 |
| 2021–22 | $394,918,007 |
5. Capital and current expenditure over time
In 2021–22, out of the $394 million spent on R&D by the Queensland Government, capital expenditure accounted for $24 million while current expenditure accounted for $370 millionof the total budget. The largest amount spent on capital expenditure was reported by the Department of Transport and Main Roads at $13 million (51 per cent) of the total capital expenditure for the year, followed by Queensland Health at $6 million (25 per cent) of the total capital expenditure for the year.
Capital expenditure refers to infrastructure spending such as buildings, land and equipment, while current expenditure refers to operational spending such as employee expenses, salaries and other R&D related expenditure.
The year 2009–10 was the first year where capital and current expenditure were reported separately. Prior to this period, they had always been reported as a combined total amount.
| Year | Capital expenditure ($) | Current expenditure ($) |
|---|---|---|
| 2009–10 | $222,900,000 | $343,100,000 |
| 2010–11 | $288,000,000 | $413,000,000 |
| 2011–12 | $213,200,000 | $420,800,000 |
| 2012–13 | $117,300,000 | $405,700,000 |
| 2013–14 | $9,800,000 | $352,200,000 |
| 2014–15 | $11,000,000 | $342,294,400 |
| 2015–16 | $22,300,000 | $291,256,200 |
| 2016–17 | $21,100,000 | $330,376,700 |
| 2017–18 | $9,706,238 | $343,071,186 |
| 2018–19 | $12,927,076 | $331,106,809 |
| 2019–20 | $13,759,337 | $366,623,186 |
| 2020–21 | $27,911,992 | $416,826,248 |
| 2021–22 | $24,934,704 | $369,983,303 |
6. Research location over time
The graph below reports the location where the R&D funding was spent as either in-house or external. In-house refers to R&D being conducted at Queensland Government sites. R&D activity occurring at non-Queensland Government facilities has been categorised as external.
From 2004 to 2010, R&D carried out in government facilities exceeded R&D at external sites. From 2010 to 2014, in line with the increase in capital expenditure, the trend shifted to having the larger portion of R&D expenditure being more at external sites. From 2014 onwards, the trend reverts to higher expenditure on in-house R&D activities.
| Year | In-house ($) | External ($) |
|---|---|---|
| 2004–05 | $167,000,000 | $62,000,000 |
| 2005–06 | $166,000,000 | $65,000,000 |
| 2006–07 | $176,000,000 | $52,000,000 |
| 2007–08 | $176,000,000 | $89,000,000 |
| 2008–09 | $286,000,000 | $247,000,000 |
| 2009–10 | $312,000,000 | $254,000,000 |
| 2010–11 | $286,000,000 | $415,000,000 |
| 2011–12 | $238,000,000 | $396,000,000 |
| 2012–13 | $224,000,000 | $299,000,000 |
| 2013–14 | $73,000,000 | $289,000,000 |
| 2014–15 | $200,964,453 | $152,329,967 |
| 2015–16 | $183,956,190 | $129,600,021 |
| 2016–17 | $188,191,162 | $163,285,552 |
| 2017–18 | $206,004,019 | $146,773,405 |
| 2018–19 | $222,386,210 | $121,647,675 |
| 2019–20 | $250,942,219 | $129,440,305 |
| 2020–21 | $291,466,760 | $153,271,480 |
| 2021–22 | $273,330,635 | $121,587,372 |
7. Total expenditure by agency in 2021-22
Queensland Government agencies reported spending a total of $394 million on R&D in 2021-22. The three agencies with the highest expenditure were:
- Queensland Health—$127 million accounting for 32% of total R&D expenditure
- Department of Agriculture and Fisheries—$107 million accounting for 27% of total R&D expenditure
- QIMR Berghofer Medical Research Institute—$46 million accounting for 11% of total R&D expenditure
| Department | Expenditure ($) |
|---|---|
| Queensland Health | $127,315,312.86 |
| Department of Agriculture and Fisheries | $107,464,664.79 |
| QIMR Berghofer Medical Research Institute | $45,525,878.52 |
| Department of Tourism, Innovation and Sport | $28,834,971.92 |
| Department of Transport and Main Roads | $25,314,572.96 |
| Motor Accident Insurance Commission | $18,502,796.09 |
| Department of Education | $12,859,825.06 |
| Department of Resources | $12,106,402.00 |
| Department of Environment and Science | $9,250,523.70 |
| Queensland Corrective Services | $3,357,687.36 |
| Department of Regional Development, Manufacturing and Water | $1,191,486.25 |
| Queensland Competition Authority | $1,000,382.00 |
| Department of Children, Youth Justice and Multicultural Affairs | $757,175.84 |
| Department of Communities, Housing and Digital Economy | $547,954.93 |
| Department of Seniors, Disability Services and Aboriginal and Torres Strait Islander Partnerships | $369,730.00 |
| Queensland Fire and Emergency Services | $308,470.00 |
| Resources Safety and Health Queensland | $72,429.15 |
| Queensland Police Service | $50,000.00 |
| Department of Justice and Attorney General | $45,253.00 |
| Department of State Development, Infrastructure, Local Government and Planning | $42,491.00 |
8. Year-on-year expenditure by agency
The table below reports the year-on-year (YoY) expenditure by agency. The largest dollar amount increase was reported by the Department of Agriculture and Fisheries at $6 million YoY, followed by Queensland Corrective Services at $3 million YoY, and QIMR Berghofer Medical Research Institute at $1 million YoY.
The largest dollar amount decrease was reported by Queensland Health at $25 million YoY. Queensland Health confirmed that over the last four years the R&D expenditure was on an upward trajectory. This year the expenditure fell to similar level to 2019-20 figure. Out of the 23 departments involved in this report, 15 agencies reported a decrease in YoY R&D expenditure, while eight agencies reported an increase.
| Department | 2020-21 expenditure ($) | 2021-22 expenditure ($) |
|---|---|---|
| Queensland Health | $152,757,745.67 | $127,315,312.86 |
| Department of Agriculture and Fisheries | $101,508,150.42 | $107,464,664.79 |
| QIMR Berghofer Medical Research Institute | $44,556,330.00 | $45,525,878.52 |
| Department of Tourism, Innovation and Sport | $30,998,028.89 | $28,834,971.92 |
| Department of Transport and Main Roads | $25,324,713.54 | $25,314,572.96 |
| Motor Accident Insurance Commission | $19,775,701.23 | $18,502,796.09 |
| Department of Education | $15,415,359.17 | $12,859,825.06 |
| Department of Resources | $15,649,034.00 | $12,106,402.00 |
| Department of Environment and Science | $10,300,904.90 | $9,250,523.70 |
| Queensland Corrective Services | $450,467.72 | $3,357,687.36 |
| Department of Regional Development, Manufacturing and Water | $814,771.55 | $1,191,486.25 |
| Queensland Competition Authority | $2,113,676.00 | $1,000,382.00 |
| Department of Children, Youth Justice and Multicultural Affairs | $1,082,302.90 | $757,175.84 |
| Department of Communities, Housing and Digital Economy | $387,538.00 | $547,954.93 |
| Department of Seniors, Disability Services and Aboriginal and Torres Strait Islander Partnerships | $0 | $369,730.00 |
| Queensland Fire and Emergency Services | $505,000.00 | $308,470.00 |
| Resources Safety and Health Queensland | $65,405.98 | $72,429.15 |
| Queensland Police Service | $53,860.00 | $50,000.00 |
| Department of Justice and Attorney General | $44,945.00 | $45,253.00 |
| Department of State Development, Infrastructure, Local Government and Planning | $16,350,000.00 | $42,491.00 |
| Department of Energy and Public Works | $100,000.00 | $0 |
| Inspector-General Emergency Management | $95,097.00 | $0 |
| Queensland Museum | $6,389,208.00 | $0 |
9. Queensland Government vs leveraged funds by year
Queensland Government funds are those spent directly from the state budget allocation. Leveraged funds refer to cash contributions from external organisations towards R&D projects funded or performed by the government. The trend reported below shows that leveraged funds have often been slightly lower than Queensland Government investment. A significant exception to this trend occurred from 2009–10 to 2012–13, where leveraged funds were used for the construction of research infrastructure.
| Year | Queensland Government funds ($) | Leveraged funds ($) |
|---|---|---|
| 2004–05 | $168,000,000 | $61,000,000 |
| 2005–06 | $176,000,000 | $55,000,000 |
| 2006–07 | $174,000,000 | $54,000,000 |
| 2007–08 | $196,000,000 | $70,000,000 |
| 2008–09 | $385,000,000 | $148,000,000 |
| 2009–10 | $365,000,000 | $201,000,000 |
| 2010–11 | $295,000,000 | $406,000,000 |
| 2011–12 | $231,000,000 | $403,000,000 |
| 2012–13 | $203,000,000 | $320,000,000 |
| 2013–14 | $185,000,000 | $177,000,000 |
| 2014–15 | $179,988,045 | $173,306,376 |
| 2015–16 | $163,754,415 | $149,801,795 |
| 2016–17 | $175,888,951 | $175,587,763 |
| 2017–18 | $172,347,785 | $180,429,639 |
| 2018–19 | $161,664,458 | $182,369,427 |
| 2019–20 | $226,331,724 | $154,138,087 |
| 2020–21 | $242,383,617 | $202,354,623 |
| 2021–22 | $217,041,935 | $177,876,073 |
10. Source of funds in 2021–22
In 2021–22, out of the $394 million that was spent on R&D, the Queensland Government leveraged $177 million (45 per cent) of the yearly R&D expenditure from external sources. This proportion of leveraged funds was exactly the same as for 2020–21, where 45 per cent of the $202 million was from external sources.
Queensland Government’s funds include in-house, government bodies and statutory authorities, and other government departments. External sources include funding from the Australian Government, universities, private non-profit organisations, overseas locations, other state/local government, other Australian locations, joint business/government organisations e.g. Cooperative Research Centres (CRCs), and businesses.
| Source of funds | Expenditure ($) |
|---|---|
| Australian Government | $54,467,358.64 |
| Business | $39,548,760.25 |
| Government bodies and statutory authorities | $31,711,758.54 |
| In house | $164,713,038.69 |
| Joint business/government organisations | $37,846,213.51 |
| Other Australian locations | $156,871.24 |
| Other Queensland Government departments | $20,617,137.70 |
| Other State/Local Government | $5,789,328.99 |
| Overseas locations | $7,799,827.25 |
| Private non-profit organisations | $9,693,483.47 |
| Universities | $22,574,229.16 |
11. Socio-economic objectives
Agencies classify R&D investment according to the Australian Bureau of Statistics’ socio-economic objectives. The objectives relate to the impact of the research and are standardised fields. The distribution of expenditure reflects the socio-economic focus of the government policy priorities at the time.
In 2021–22, the greatest reported expenditure was allocated to health objectives. This investment accounted for 50 per cent ($197 million) of the R&D expenditure for the year. The second largest expenditure at 18 per cent ($69 million) was for research on plant production and plant primary products followed by transport accounting for 8 per cent ($31 million). This allocation is in line with what happened in 2020–21 where health accounted for 52 per cent ($230 million) of the overall R&D expenditure, followed by plant production and plant primary products at 15 per cent ($65 million). However, the third ranked socio-economic objective in 2020–21 was environmental management at 7.5 per cent ($33 million) while transport only accounted for 5 per cent ($24 million) and was ranked fifth.
| Socio-economic objective | Expenditure ($) |
|---|---|
| Health | $197,096,833.65 |
| Plant production and plant primary products | $69,766,036.58 |
| Transport | $31,629,177.10 |
| Animal production and animal primary products | $26,862,027.39 |
| Environmental management | $20,982,894.90 |
| Education and training | $11,913,165.23 |
| Mineral resources (excl. energy resources) | $10,563,683.08 |
| Expanding knowledge | $5,997,145.78 |
| Environmental policy, climate change and natural hazards | $4,064,817.21 |
| Law, politics and community services | $3,690,213.89 |
| Defence | $3,500,000.00 |
| Manufacturing | $3,463,003.58 |
| Energy | $2,313,516.91 |
| Construction | $1,045,650.81 |
| Indigenous | $641,613.37 |
| Information and communication services | $471,980.96 |
| Commercial services and tourism | $317,409.82 |
| Economic framework | $306,656.17 |
| Culture and society | $292,181.00 |
12. Field of research
Similar to socio-economic objectives, fields of research are also defined by the Australian Bureau of Statistics.
In 2021–22, the top three reported fields of research were: biomedical and clinical sciences accounting for 27 per cent ($106 million), followed by agricultural, veterinary and food sciences accounting for 26 per cent ($104 million) and health sciences accounting for 22 per cent ($85 million). This categorisation shows that 75 per cent of the total expenditure is concentrated in just three of the 23 fields of research. This concentration mirrors the highest spending agencies, namely Queensland Health, the Department of Agriculture and Fisheries, and QIMR Berghofer Medical Research Institute. This trend is in line with what was reported in 2020–21 where biomedical and health sciences accounting for 51 per cent ($227 million) of the overall expenditure, followed by Agricultural and Veterinary Sciences at 22 per cent ($97 million).
| Field of research | Expenditure ($) |
|---|---|
| Biomedical and clinical sciences | $106,372,084.01 |
| Agricultural, veterinary and food sciences | $104,614,605.83 |
| Health sciences | $85,763,507.36 |
| Engineering | $29,705,467.10 |
| Education | $14,051,776.22 |
| Environmental sciences | $13,583,021.87 |
| Earth sciences | $11,877,122.28 |
| Information and computing sciences | $8,645,580.51 |
| Psychology | $6,213,629.44 |
| Biological sciences | $3,879,196.87 |
| Human society | $3,845,322.73 |
| Economics | $1,836,599.78 |
| Law and legal studies | $1,146,053.00 |
| Built environment and design | $1,106,725.00 |
| Chemical sciences | $726,757.47 |
| Commerce, management, tourism and services | $706,344.88 |
| Mathematical sciences | $411,678.74 |
| Physical studies | $340,138.00 |
| Indigenous studies | $92,396.35 |
13. Queensland Government priorities
The chart below reports the weighted percentage of Queensland Government priorities for the community in 2021–22. The highest percentage was for backing our frontline services accounting for 29 per cent, followed by growing our regions at 15 per cent, and protecting the environment at 13 per cent. The chart reports a similar distribution to what was reported in 2020–21 where backing our frontline services accounted for 22 per cent, protecting the environment at 15 per cent, and safeguarding our health at 11 per cent.
Other stands for projects that did not align with government priorities and in 2021–22 accounted for 13 per cent of the overall projects. This allocation is in line with what was reported in 2020–21 where other also accounted for 13 per cent of the overall projects.
| State priority | % |
|---|---|
| Backing our frontline services | 29.46 |
| Growing our regions | 14.79 |
| Other | 13.46 |
| Protecting the environment | 13.32 |
| Supporting jobs | 12.15 |
| Safeguarding our health | 6.25 |
| Investing in skills | 4.44 |
| Backing small business | 2.32 |
| Building Queensland | 1.94 |
| Making it for Queensland | 1.87 |